Enterprise Spend by Category.png
An official website of the State of Georgia.
The .gov means it’s official.
Local, state, and federal government websites often end in .gov. State of Georgia government websites and email systems use “georgia.gov” or “ga.gov” at the end of the address. Before sharing sensitive or personal information, make sure you’re on an official state website.
Still not sure?
Call 1-800-GEORGIA to verify that a website is an official website of the State of Georgia.
The state of Georgia spends a large sum of money every year on IT including services, equipment, applications, personnel, software licensing, development, and maintenance. However, determining exactly how much is spent, where the money goes, and what taxpayers are getting in return can be difficult to report on in the aggregate. Coupled with this challenge is the need to better understand whether Georgia is receiving or could receive greater value for the dollars invested in IT. This is likely to be a continuing challenge due to the rapid changes in technology each year.
The General Assembly has charged the Georgia Technology Authority (GTA) with compiling information from executive branch agencies about their IT expenditures and presenting a report to state leaders every year (O.C.G.A. 50-25-7.10). With comprehensive and accurate information, state leaders can make facts-based decisions about the allocation of limited state resources to support technology.
GTA uses the State Technology Annual Report Register (STARR) to collect data about IT expenditures from executive branch agencies. Information is requested in the categories of application, infrastructure, network, other IT costs, and projects.
The state has a more comprehensive understanding of the cost of infrastructure and network services than it does for applications. Infrastructure and network services are provided through the Georgia Enterprise Technology Services (GETS) program. Under GETS, Georgia can measure consumption and value through detailed reporting for all agency users of infrastructure and network services.
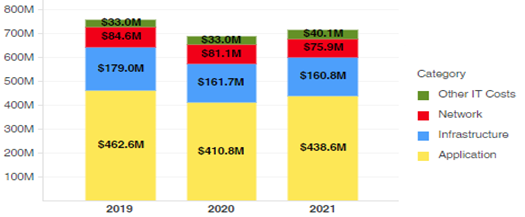
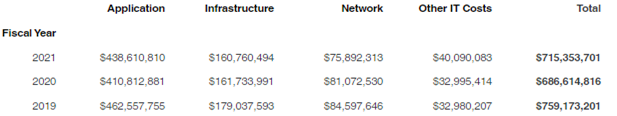
The following graph depicts the most comprehensive summary available of IT expenditures by infrastructure, network, application, and other IT costs in FY 2019, FY 2020, and FY 2021.
A total of 46 agencies submitted a report.
Complete listings of the agencies reporting and their expenditures are in the Appendix.
The agencies listed in Appendix A with NR in the "Reported 2021" column did not submit reports because:
In addition to constitutional agencies, other state entities with large IT budgets are not required to report their IT expenditures, including the University System of Georgia.
Participating agencies spent over $715 million on technology in FY 2021, more than the $686 million reported in FY 2020. Several agencies increased their IT spend by incurring additional application costs. The difference in spending is attributable to:
GTA continues working with agencies to increase both the quantity and quality of data received.
GTA’s investment strategy sessions in FY 2021 included agency decision makers in business, operations, and finance. The agenda was targeted to increase awareness of the challenges associated with technology investments while also providing tools and best practices for a variety of investment scenarios. The information gathered in these sessions provides the baseline for annual reporting on Planned New Investments as shown below.
GTA enhanced the procurement review process to provide more proactive support as agencies plan for large investments.
GTA’s procurement review process continues to provide valuable feedback as agencies navigate complex Requests for Proposal (RFPs) and provider service agreements. Over the past year, GTA reviewed more than 12 sets of procurement documents, including RFPs, Requests for Information (RFIs), Scopes of Work (SOWs), and contracts representing approximately $143 million in investments.
The state’s IT application portfolio included 840 applications in FY 2021, an increase of 268 since FY 2013. The following graph shows the number and percentage of applications by type:
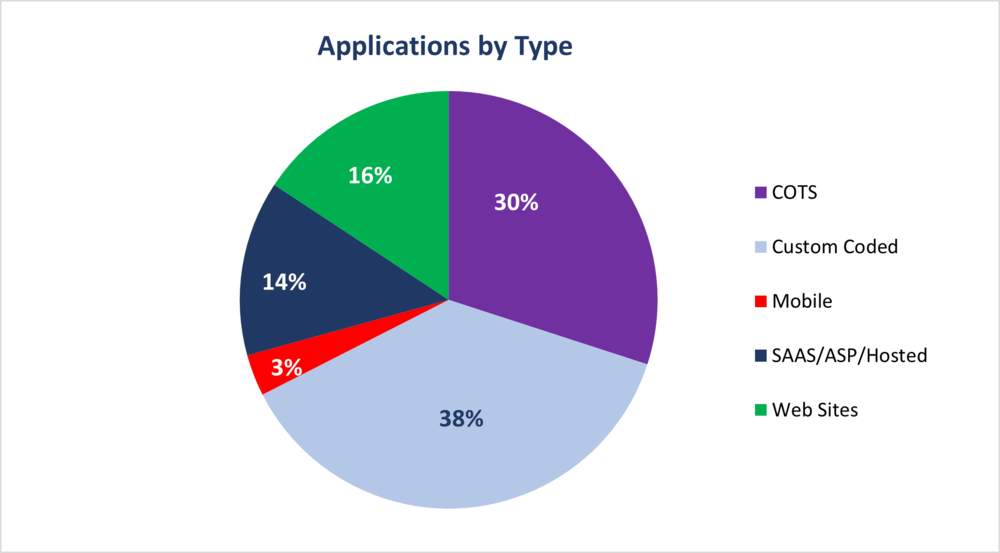
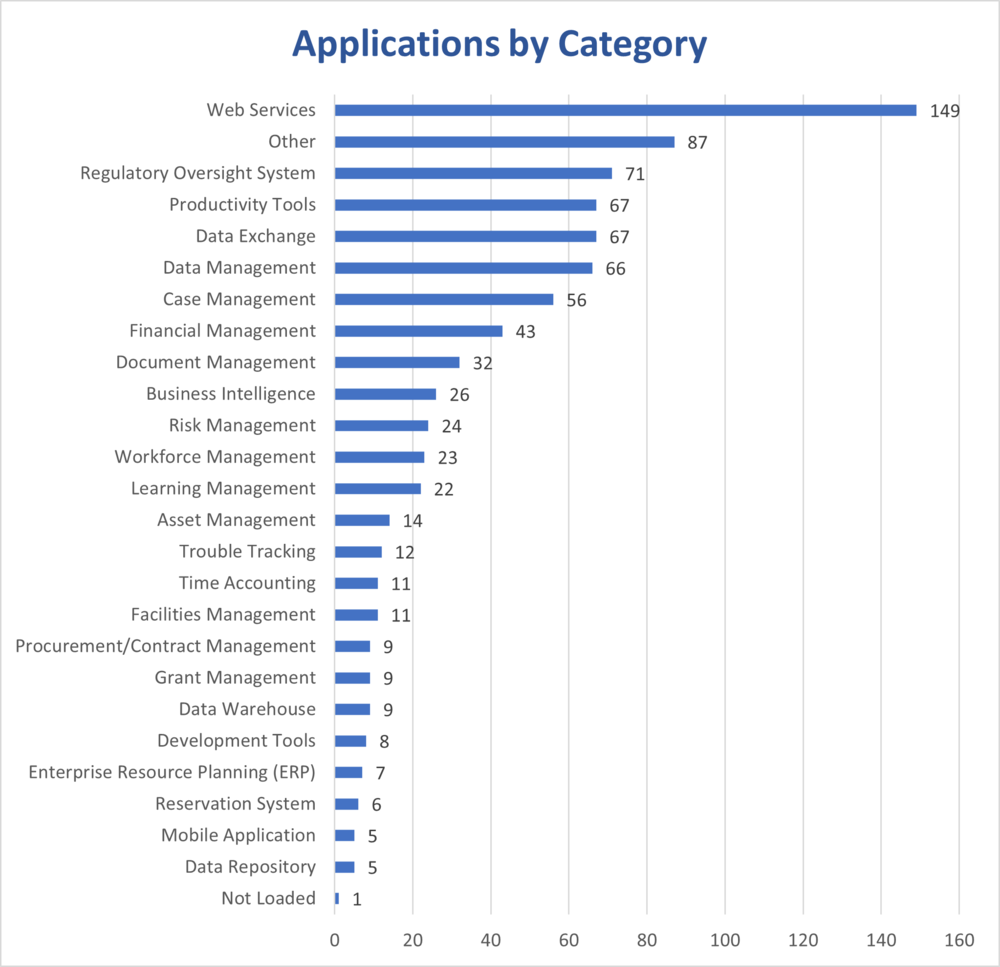
The graph above shows the number of applications by category.
Note: These applications were categorized by the reporting agency based on definitions provided by GTA. Many applications are accessible on mobile devices, but they are not categorized as mobile-only applications.
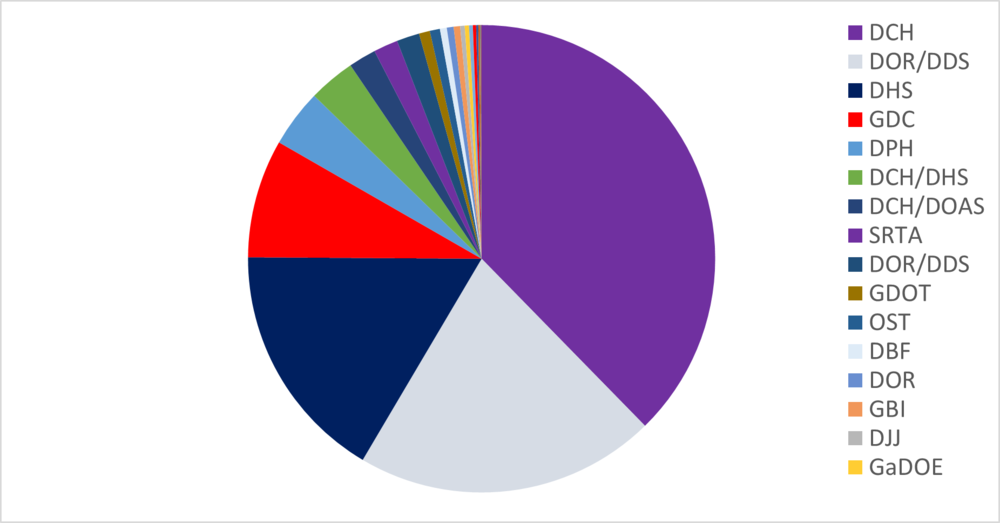
The total portfolio of in-flight and planned projects is $876 million. The FY 2021 active project portfolio of $525 million shows a decrease from FY 2020, primarily due to the large healthcare initiatives that have been implemented and greater accuracy in planning estimates. The FY 2021 portfolio is tracking more than 56 active projects in 20 agencies, with several projects spanning multiple years. In addition to the active projects, several large projects totaling $351 million are in the planning phase.
The following chart/graph depicts each agency’s percentage of the total budget for all active projects.
|
Dept of Community Health |
$198,000,000 |
37.7% |
|
Dept of Revenue/Dept of Drivers Services |
$117,768,763 |
22.4% |
|
Dept of Human Services |
$87,246,142 |
16.6% |
|
Dept of Corrections |
$43,059,354 |
8.2% |
|
Dept of Public Health |
$20,952,710 |
4.0% |
|
Dept of Community Health/Dept of Human Services |
$16,983,391 |
3.2% |
|
Dept of Community Health/Dept of Administrative Services |
$10,000,000 |
1.9% |
|
State Road and Tollway Authority |
$8,893,951 |
1.7% |
|
Dept of Transportation |
$3,933,125 |
0.7% |
|
Office of the State Treasurer |
$3,702,141 |
0.7% |
|
Dept of Banking and Finance |
$2,500,000 |
0.5% |
|
Dept of Revenue |
$2,471,895 |
0.5% |
|
Georgia Bureau of Investigation |
$2,356,620 |
0.4% |
|
Dept of Juvenile Justice |
$1,631,975 |
0.3% |
|
Dept of Education |
$1,548,500 |
0.3% |
|
GA Government Transparency & Campaign Finance Comm |
$1,394,918 |
0.3% |
|
Dept of Behavioral Health |
$1,171,349 |
0.2% |
|
Secretary of State |
$800,000 |
0.2% |
|
Dept of Administrative Services |
$574,346 |
0.1% |
|
Technical College System of Georgia |
$350,000 |
0.1% |
|
Dept of Community Affairs |
$168,373 |
0.0% |
|
Georgia Firefighters Pension Fund |
$81,132 |
0.0% |
|
$525,669,815 |
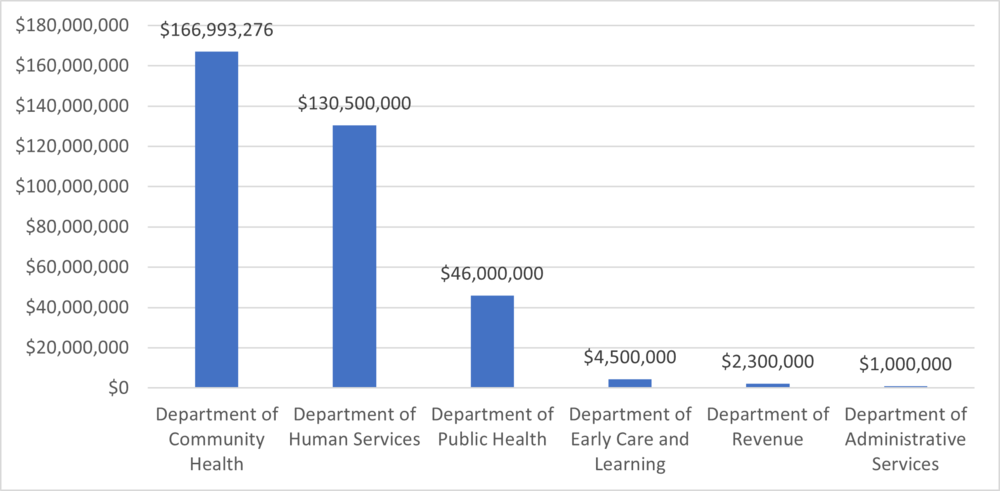
The following graph depicts the several large projects totaling $351 million that are in the planning phase.
|
Department of Community Health |
$166,993,276 |
|
Department of Human Services |
$130,500,000 |
|
Department of Public Health |
$46,000,000 |
|
Department of Early Care and Learning |
$4,500,000 |
|
Department of Revenue |
$2,300,000 |
|
Department of Administrative Services |
$1,000,000 |
|
$351,293,276 |
The monthly reviews of the Critical Project Review Panel continue to have a positive impact on the success of the monitored projects. The panel limits its reviews to the most critical projects in the state’s portfolio. For FY 2021, the critical project portfolio was valued at $484 million and encompassed 22 projects in 12 agencies.
The information below puts into perspective the value and benefits of portfolio management and oversight.
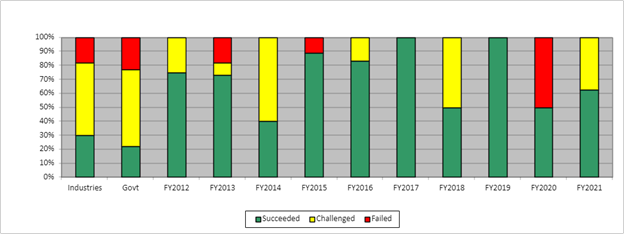
Without disciplined project management, the eight projects completed, with a value of $186 million, would have delivered only 77 percent of the functionality originally planned.
Applying industry statistical information (based on the Standish Group’s 2020 CHAOS Report) to our completed projects that reported to the Critical Project Review Panel yields the following results:
23% of projects would be cancelled = $42.9 million
55% would cost 189% of the original estimate = $193.8 million
22% would be successful with no cost increase = $41.0 million
The chart below displays how the state of Georgia compares to government and industry metrics compiled for the Standish Group’s 2020 CHAOS Report for technology projects. It measures only critical IT projects that were completed in each fiscal year. The chart indicates a significant increase in successful projects from FY 2020 to FY 2021. Of the 22 projects in the critical project portfolio, eight large projects were completed this year.