Enterprise IT Spend.png
An official website of the State of Georgia.
The .gov means it’s official.
Local, state, and federal government websites often end in .gov. State of Georgia government websites and email systems use “georgia.gov” or “ga.gov” at the end of the address. Before sharing sensitive or personal information, make sure you’re on an official state website.
Still not sure?
Call 1-800-GEORGIA to verify that a website is an official website of the State of Georgia.
The state makes significant annual investments in IT, including services, equipment, applications, personnel, software licensing, development, and maintenance. How much is spent in total, where the money goes, and what taxpayers get in return can be difficult to pinpoint.
The Georgia General Assembly has charged GTA with compiling IT expenditure information from executive branch agencies. GTA presents a report every year as defined in O.C.G.A. 50-25-7.10. This data allows state leaders to make facts-based decisions about allocation of state resources for technology.
To collect the data, GTA uses the State Technology Annual Report Register (STARR). Information is requested from executive branch agencies about application, infrastructure, network, other IT costs, and projects.
The state has a more comprehensive accounting of expenses for infrastructure and network services than for applications. Infrastructure and network services are provided through the Georgia Enterprise Technology Services (GETS) program. Under GETS, Georgia can measure consumption through detailed reporting for all agency users of infrastructure and network services.
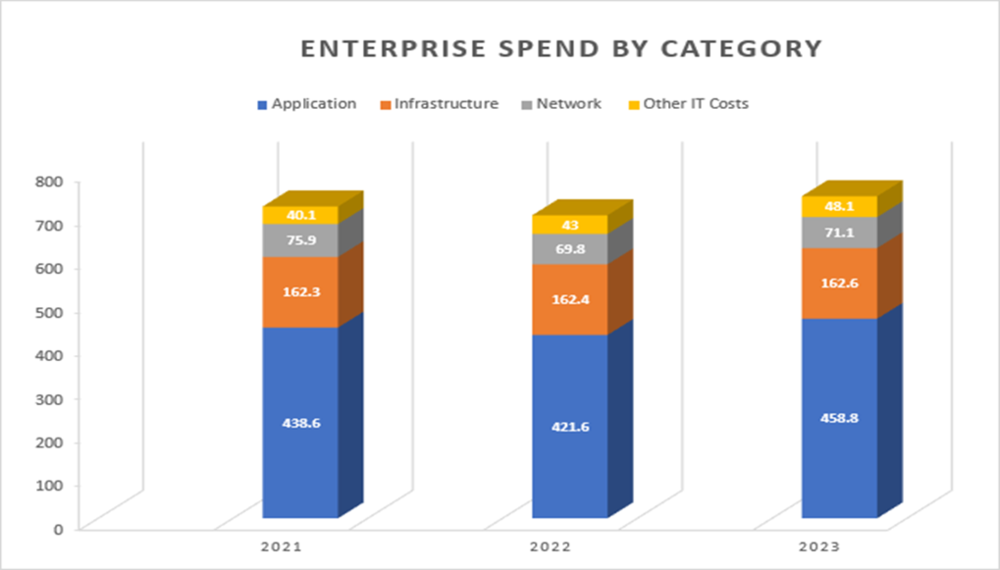
The following graph depicts the most comprehensive summary available of IT expenditures by infrastructure, network, application, and other IT costs in FY 2021, FY 2022, FY 2023. Note, numbers are in millions of dollars.
Sixty-one agencies reported their IT expenditures.
Complete listings of the agencies reporting and their expenditures are in appendices. The agencies listed in Appendix A with "NR" in the "reported 2023" column did not submit reports because of one of the following reasons:
In addition to constitutional agencies, other state entities with large IT budgets (e.g., the University System of Georgia) are not required to report their IT expenditures.
Participating agencies spent over $740 million on technology in FY 2023. GTA continues collaborating with agencies to increase both the quantity and quality of IT spend data received.
GTA’s investment strategy sessions in FY 2023 included agency decision-makers in business, operations, and finance. The agenda was targeted to increase awareness of the challenges associated with technology investments while also providing tools and best practices for a variety of investment scenarios. The information gathered in these sessions provides the baseline for annual reporting on planned new investments below.
GTA enhanced the procurement review process to provide more proactive support as agencies plan for large investments. GTA’s procurement review process continues to provide valuable feedback as agencies navigate complex requests for proposal (RFPs) and provider service agreements. Over the past year, GTA reviewed more than 23 sets of procurement documents, including RFPs, requests for information (RFIs), scopes of work (SOWs), and contracts representing approximately $316 million in investments.
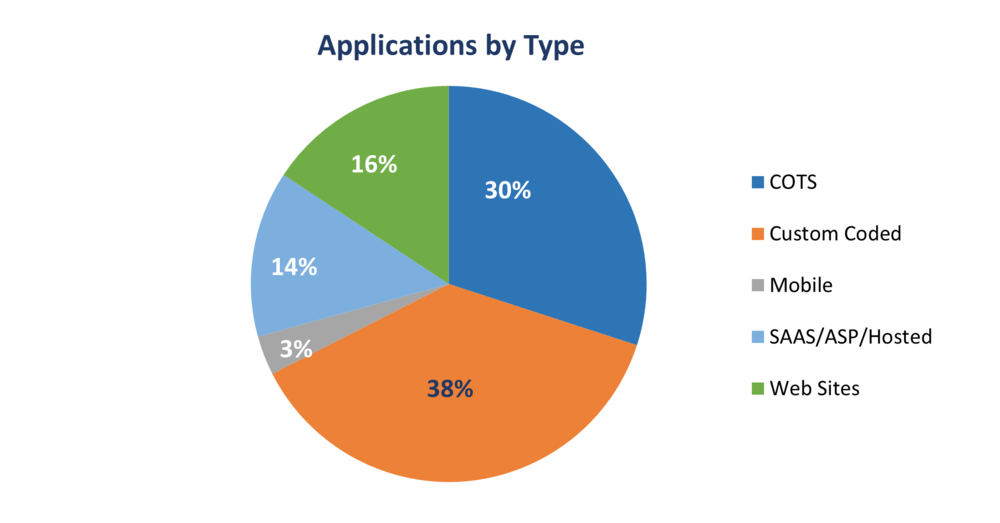
The state’s IT application portfolio included 908 applications in FY 2023, an increase of 282 since FY 2013. The following graph shows the number and percentage of applications by type:
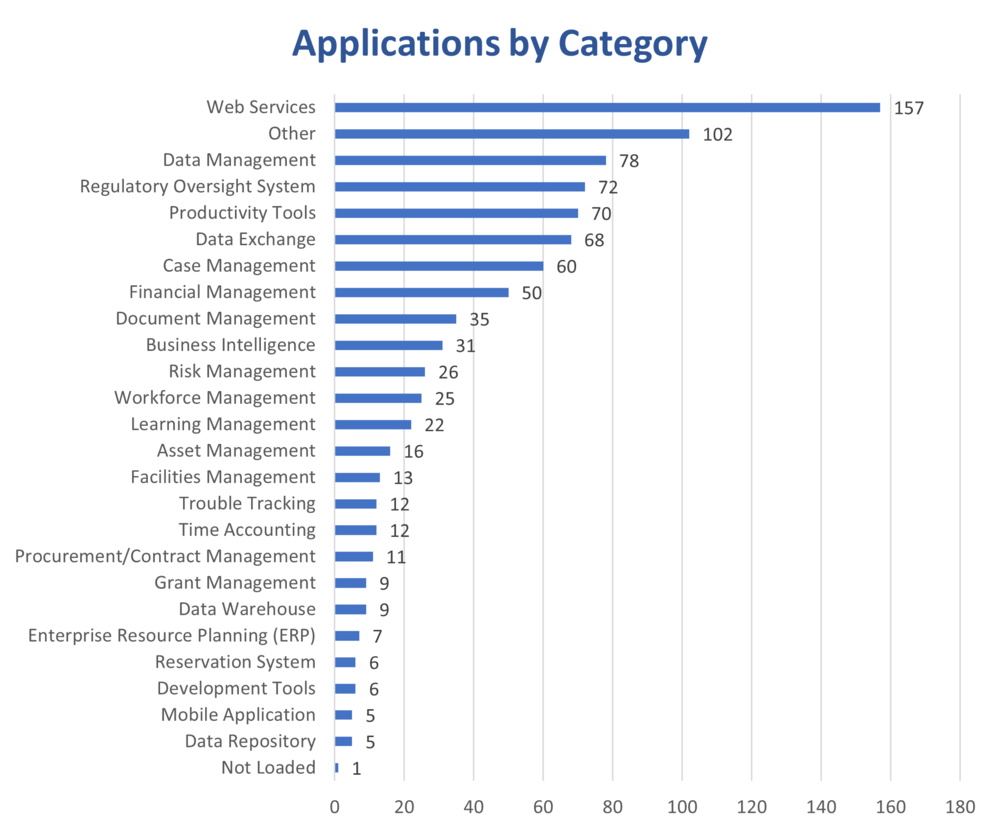
The graph above shows the number of applications by category. Note, these applications were categorized by the reporting agency based on definitions provided by GTA. Many applications are accessible on mobile devices, but they are not categorized as mobile-only applications.
The total portfolio of in-flight and planned projects is $903 million; the FY 2023 active project portfolio is $580 million. The FY 2023 portfolio is tracking more than 90 active projects in 21 agencies, with several projects spanning multiple years. In addition to the active projects, several large projects totaling $323 million are in the planning phase.
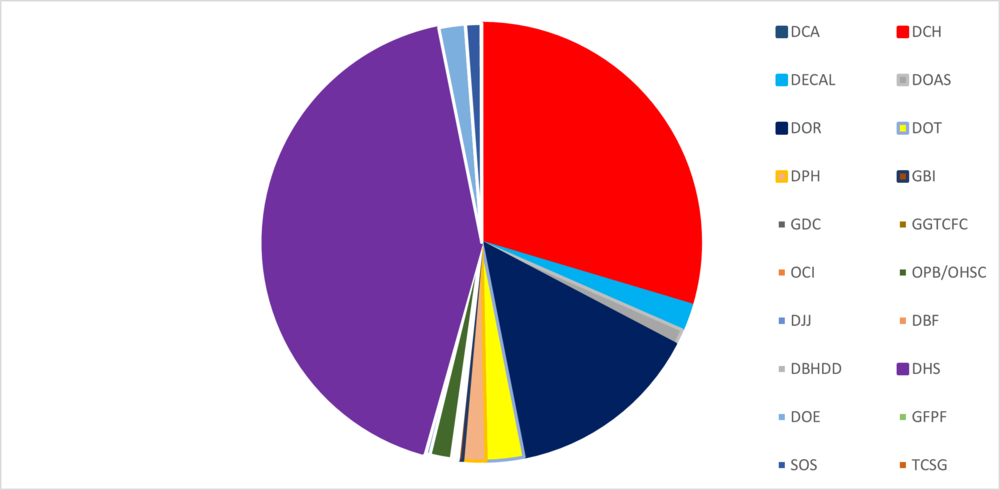
The following chart and graph depict each agency’s percentage of the total budget for all active projects.
|
Dept. of Human Services |
$351,289,496.02 |
42.5% |
|---|---|---|
|
Dept. of Community Health |
$244,448,779.00 |
29.6% |
|
Dep. of Revenue |
$117,547,534.00 |
14.2% |
|
Dept. of Transportation |
$23,100,000.00 |
2.8% |
|
Dept. of Early Care and Learning |
$16,125,210.00 |
1.9% |
|
Dept. of Education |
$16,111,000.00 |
1.9% |
|
Dept. of Public Health |
$14,080,000.00 |
1.7% |
|
Office of Planning and Budget |
$13,133,240.00 |
1.6% |
|
Secretary of State |
$9,500,000.00 |
1.1% |
|
Dept. of Administrative Services |
$9,333,626.00 |
1.1% |
|
Georgia Bureau of Investigation |
$2,723,600.00 |
0.3% |
|
Dept. of Juvenile Justice |
$2,500,000.00 |
0.3% |
|
Dept. of Behavioral Health and Developmental Disabilities |
$1,817,689.08 |
0.2% |
|
Dept. of Corrections |
$1,500,000.00 |
0.2% |
|
Govt. Transparency and Campaign Finance Comm. |
$1,394,918.00 |
0.2% |
|
Office of Commissioner of Insurance |
$1,306,000.00 |
0.2% |
|
Dept. of Community Affairs |
$500,000.00 |
0.1% |
|
Technical College System |
$350,000.00 |
0.0% |
| Dept. of Banking and Finance | $330,872.00 | 0.0% |
| Firefighters' Pension Fund | $140,000.00 | 0.0% |
The following graph depicts several large projects totaling $427 million that are in the planning phase.
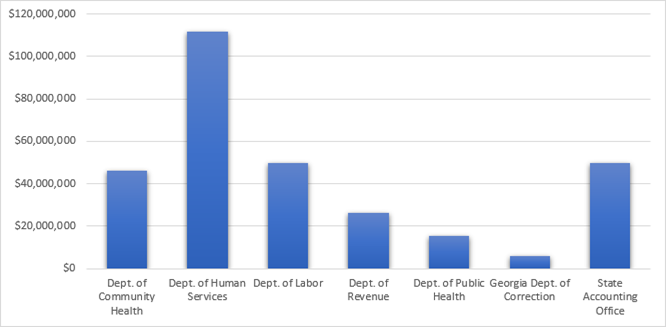
|
Dept. of Community Health |
$46,000,000 |
|---|---|
|
Dept. of Human Services |
$111,579,140 |
|
Dept. of Labor |
$49,600,000 |
|
Dept. of Revenue |
$26,499,572 |
|
Dept. of Public Health |
$15,280,000 |
|
Dept. of Corrections |
$6,000,000 |
| State Accounting Office | $50,000,000 |
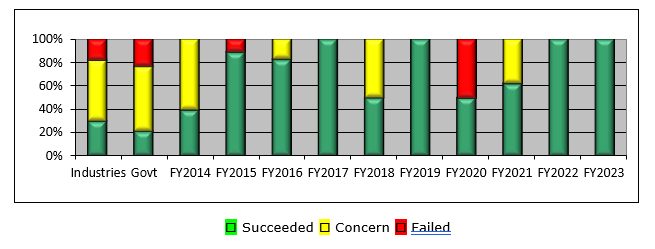
Monthly reviews by the Critical Project Review Panel continue to promote success of the most critical projects in the state’s portfolio. The oversight of these projects pays dividends.
The chart below displays how the state of Georgia’s project performance compares to government and industry metrics compiled for the Standish Group’s 2023 CHAOS Report for technology projects. The two columns on the left are industry standards. The columns that are labeled starting with FY are the results for Georgia managed projects. It measures only critical IT projects that were completed in each fiscal year. Of the 25 projects in the critical project portfolio, two were completed this year. Over the past decade, Georgia has consistently outperformed government and industry averages for project success.
The Technology Empowerment Fund (TEF) was established by legislators to provide funding for various projects, initiatives, and systems that will demonstrate cost savings and improved service deliver through technology and training. This is defined in OCGA § 50-25-7.1. Special advisory input and oversight are also directed to key technology-enabled projects administered via the Technology Empowerment Fund. Currently, one involves replacement of the PeopleSoft Enterprise Resource Planning (ERP) System administered by the State Accounting Office (SAO). The next project relates to establishing an all-payer claims database which will facilitate reporting of health care and quality data across all levels of health care, medical, pharmacy, and dental. The third involves replacing the Georgia Professional Standards Commission (PSC) Education Certification and Credential Evaluation and Ethics Case Management Applications Systems. Each of these projects entails a sizeable IT investment and will benefit from oversight from a cross-functional team of state government leaders including participating from GTA.